The World Bank’s Georgia Poverty Assessment, that was released in April of this year, offers many interesting insights into the patterns of poverty and social assistance in the country.
One highly important issue for poverty reduction in the country is the geographic distribution of the poverty headcount. According to the report, 24% of the Georgian population is ‘poor’ and 9% is ‘extremely poor’. But the regional variation is enormous. Shida Kartli, in their analysis, is the poorest region with 59% poverty while its southern neighbour Kvemo Kartli is the least poor with only 8% poverty. This is particularly significant since the data for this report was collected in early 2007 and one would imagine that the situation in Shida Kartli has become worse since the war.
In fact, in their report there are three regions that stand out with the highest poverty rate. After Shida Kartli there is Kakheti with 46% and Mtskheta-Mtianeti with 41%. This is vitally important because it suggests that these regions should be the focus of the government’s and the international community’s anti-poverty efforts. However, how sure can we be that they are right?
One set of comparison data is the list of families receiving targeted social assistance. In order to receive targeted social assistance a family has to be deemed sufficiently needy by the evaluators from the social service agency (a sub-agency of the Ministry of Labor Health and Social Affairs). About 11% of the Georgian population is covered by this program. The SSA releases a regional breakdown of the number of families receiving targeted social assistance and if one compares this to the 2002 census one can calculate rough percentages of the population receiving TSA.
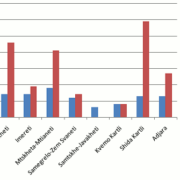
Below is a comparison between the percentage of families receiving TSA and the percentage of families in each region that are poor according to the World Bank.
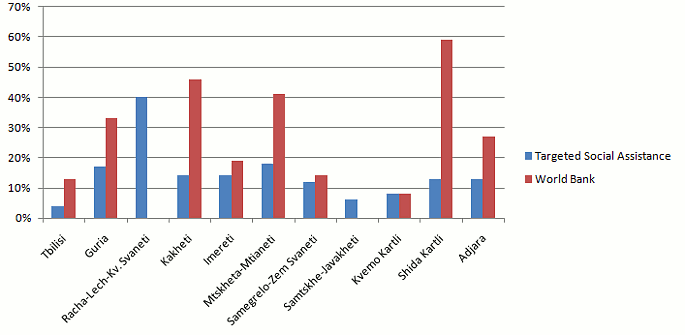
As one would expect, the TSA is lower than the World Bank Poverty head count since the WB count averages 24% of the population and the TSA averages 11% but more interesting is the fact that the order of regions is very different. For a start, according to the TSA ranking Racha-Lechkhumi and Kvemo-Svaneti is by far the poorest region in the country.
This does not really conflict with the World Bank since in the World Bank assessment the number of people interviewed in the region was too small to constitute a representative sample and so it is not listed. However, after that, the highest level of TSA recipients can be found in Mtskheta-Mtianeti and Guria.
But more importantly is that after that, the variation in poverty suggested by the World Bank is in no way reflected in regional variation of the TSA. As we can see from this, Kvemo Kartli (with the lowest level of poverty in Georgia according to the World Bank) has 8% poverty and 8% TSA coverage. In comparison, the World Bank’s Survey shows that Shida Kartli has a poverty head-count of 59% but a TSA coverage of only 13%.
The commonest reaction to this discrepancy is to suggest that the TSA is poorly targeted (even though the World Bank says that it is pretty good in the same report) and based on widely understood discrepancies the SSA is currently re-formulating the equation through which it assesses need. The problem is that it is very hard to evaluate the World Bank’s findings because the data-set they generate from their research is not available for independent scrutiny.
This is unfortunate because the dataset could not only give us confidence in much needed policy data, but could also act as a great resource for researchers in the country.


